
#Healthchecks
A healthcheck asks from outside whether something is up: a website, a port, a TLS certificate, or a scheduled job that should have reported in. It works for any address, whatever the stack behind it, and needs no sigil and no app in Lore.
Healthchecks are the Healthchecks option of the Deploy and watch apps capability, off by default, in Settings ▸ General ▸ Capabilities. Turning it on adds Uptime to the sidebar. See Capabilities.
#The Uptime page
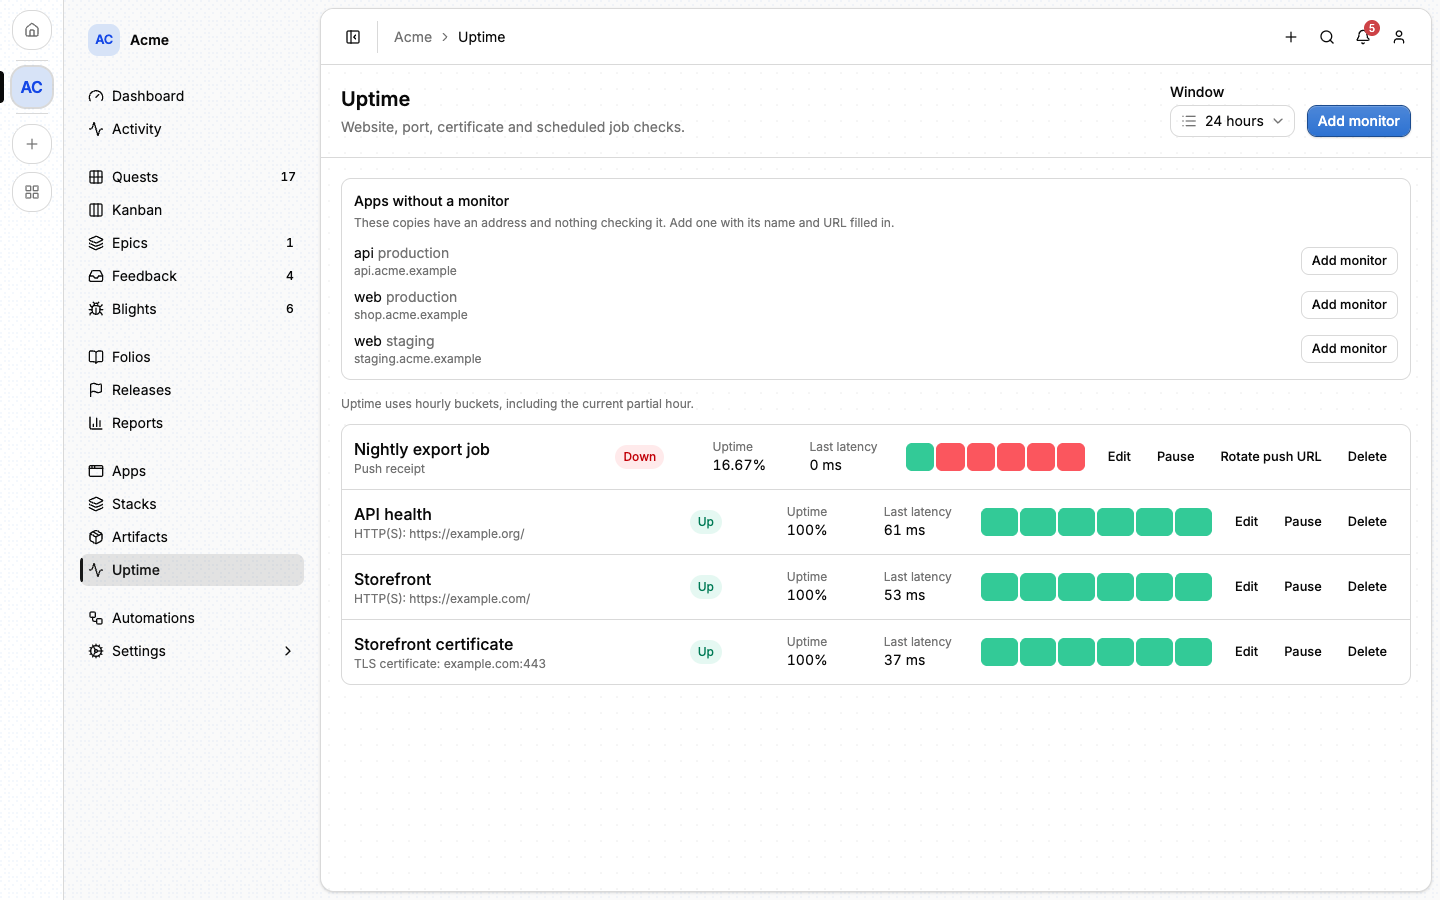
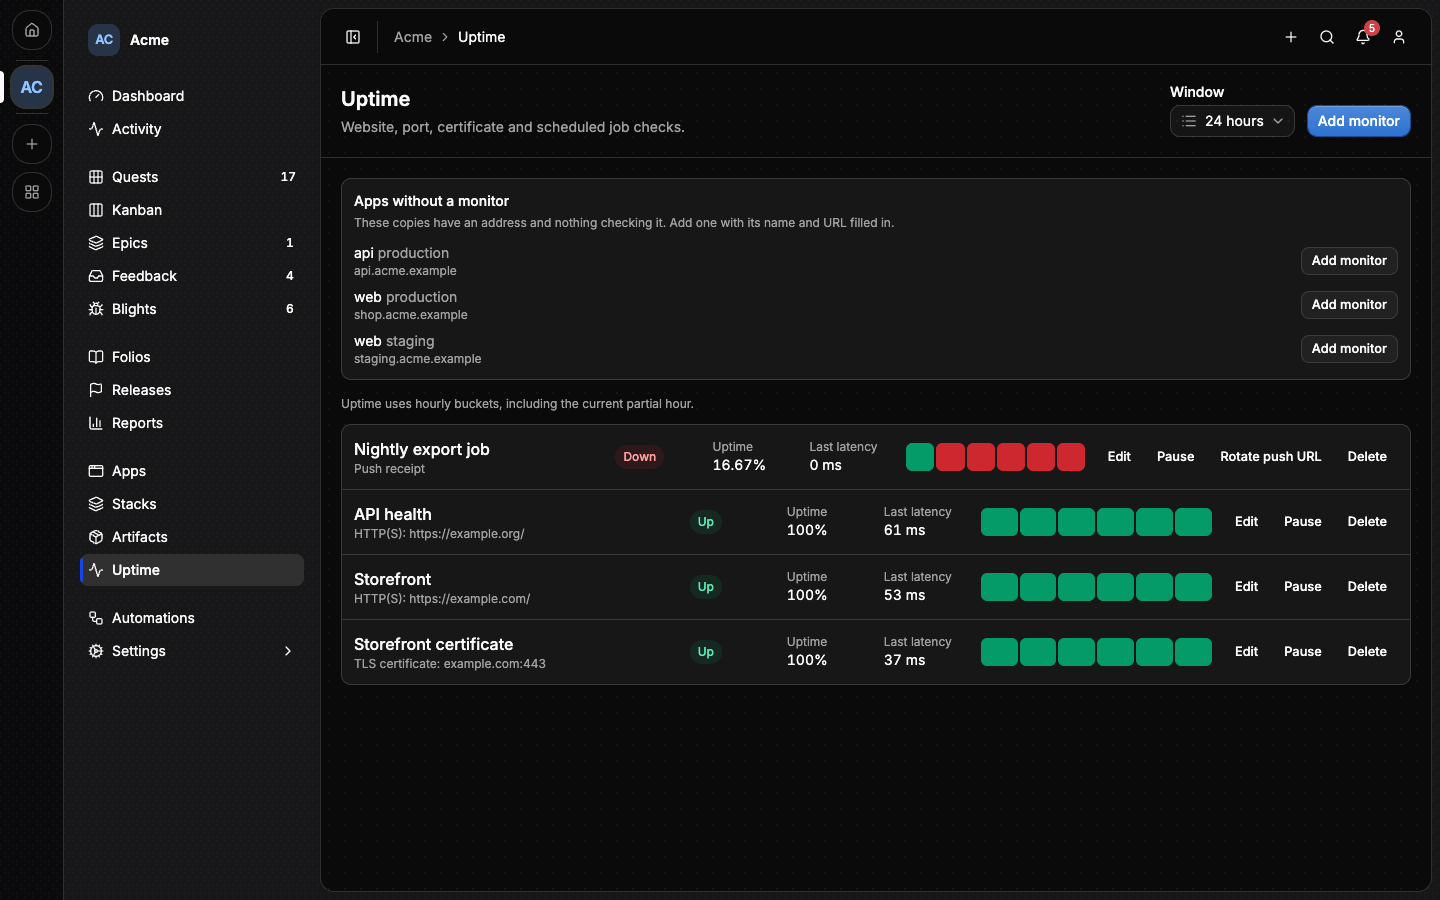
Uptime lists every monitor of the project with its status, its uptime, its last latency and a strip of its recent checks. The Window selector reads the uptime over 24 hours, 7 days or 30 days.
#Adding a monitor
- Choose Add monitor.
- Give it a name and pick its kind. The kind cannot change afterwards: create a new monitor instead.
- Enter the target and adjust the settings below.
- Choose Create monitor.
When an app instance has an address and nothing checking it, the page offers it under Apps without a monitor, and Add monitor beside it fills in the name and the URL. Ephemeral instances are not offered.
| Kind | Target | Up means |
|---|---|---|
| HTTP(S) | An http or https URL |
A GET answers a 2xx, or the expected status, and contains the keyword if one is set. A redirect is not followed. |
| TCP port | host:port |
The connection opens. |
| TLS certificate | host:port (the port defaults to 443) |
The certificate is valid and further from expiry than the warning. |
| Push receipt | None: Lore gives you a URL | The URL was called within the interval. |
A target cannot carry credentials.
⚠️ TCP and certificate monitors need a Node host. They open a raw socket,
which Cloudflare Workers cannot do, so on a Workers deployment such a monitor
fails every check with a message saying so. HTTP and push monitors work on both.
lore.alepha.dev runs on Workers; a
self-hosted image runs on Node.
| Setting | Default | Range | What it does |
|---|---|---|---|
| Interval | 60 s | From 60 s, in whole minutes | How often it is checked. On a push monitor, labelled Stale after, the silence allowed. |
| Timeout | 10 s | 1 to 30 s | How long a check waits. |
| Failures before down | 2 | 1 to 100 | Consecutive failures that open an outage. |
| Expected status | 2xx | 100 to 599 | HTTP only. |
| Body keyword | none | Up to 1,000 characters | HTTP only. The response must contain it, and be under 2 MiB. |
| Latency budget | none | In milliseconds | HTTP only. Over budget is recorded and shown as Slow, and the monitor stays up. |
| Warn before expiry | 14 days | 0 to 365 days | Certificates only. Closer than this counts as a failure. |
#Push monitors
A push monitor watches something that runs on its own schedule, such as a backup or a cron job. It is the one kind Lore does not call: the job calls Lore.
Creating one shows a private URL, once. Copy it then:
curl -fsS https://lore.alepha.dev/uptime/push/up_...Call it when the job succeeds. Each call answers 204 and restarts the clock. If nothing arrives within the interval, the check fails. Lore looks every minute, so an interval of 3600 means an hour of allowed silence, not an hourly check.
The URL can do one thing, which is record a receipt for that monitor, and Lore does not keep it in a readable form. If it leaks or is lost, Rotate push URL replaces it, and the old one stops working.
#From failures to an outage
Lore checks due monitors every minute. A failed check is not yet an outage: the monitor goes Down once Failures before down checks fail in a row, and a single success brings it back Up.
| Status | Meaning |
|---|---|
| Pending | No check has passed yet, and failures are below the threshold. |
| Up | The last check passed, or failures since are below the threshold. |
| Slow | Up, and the last check was over its latency budget. |
| Down | An outage is open. |
| Paused | Pause stops the checks. Resume starts them again. |
Pausing a monitor keeps an outage that was already open, and resuming shows it Down again until a check passes.
When an outage opens:
- An incident is recorded, with its cause and start. It closes when the monitor recovers.
- A blight named
UptimeOutageappears in the project's Blights inbox, one per monitor, with the monitor, the target and the failure. It is resolved by itself on recovery, and the next outage opens it again. The inbox stays reachable while it is open, even with no sigil in the project. It follows the retention of any open blight, so an outage that outlasts that window loses it. - An email goes out, and a second one on recovery.
One outage means one pair of emails, however long it lasts. There is no reminder while a monitor stays down, and no webhook.
#Who is alerted
Email alerts are on for a new monitor. Recipients takes up to 20 addresses, separated by commas. Left blank, the alert goes to the project's current owner. They arrive in the Healthchecks category of notification preferences, so a recipient with an account can turn them off.
#Reading a monitor
Opening a monitor from the list shows:
- Uptime over 24 hours, 7 days and 30 days, from hourly totals.
- Mean latency, over successful checks only. A gap means no successful sample, never zero.
- Recent checks: the last 50, each with its result.
- Incident history: the latest 100, with exact durations.
- The certificate's expiry, where one was seen.
Lore keeps the newest 100 individual checks per monitor, and hourly totals for the charts. Where those totals are sampled, the page says the numbers are estimated.
An app instance shows the HTTP monitor on its address on its Overview tab. The match is on the URL and nothing else, so a monitor added by hand for the same address counts.
#Changing and deleting
Each row of the list has Edit, Pause or Resume, and Delete.
Delete removes the monitor, its checks and its incidents. The hourly totals are kept, and a blight still open stays for you to resolve.
Reading monitors needs the app:read permission, which the default Member rank
holds. Creating, editing, pausing and deleting them needs app:manage, which
the owner holds and a rank can be given.
With the Healthchecks option off, no check runs, every push is refused and monitors cannot be changed, but nothing is deleted.
#From an agent
There is no MCP tool and no lore command for monitors. An outage reaches an
agent as a blight, so blight_list shows it under the name UptimeOutage.
#Next
- Telemetry: the Blights inbox an outage lands in.
- Notifications
- Apps and instances