
#Reports
Reports measures what happened in a project over a period: how much work was completed, how long it took, what is waiting, how the apps behaved. The dashboard is a page you compose. Reports is fixed, and every figure says what it counts behind an info mark.
Every project has Reports in its sidebar. Reading it needs the permission
Read the reports (stats:read), which a Member has by default.
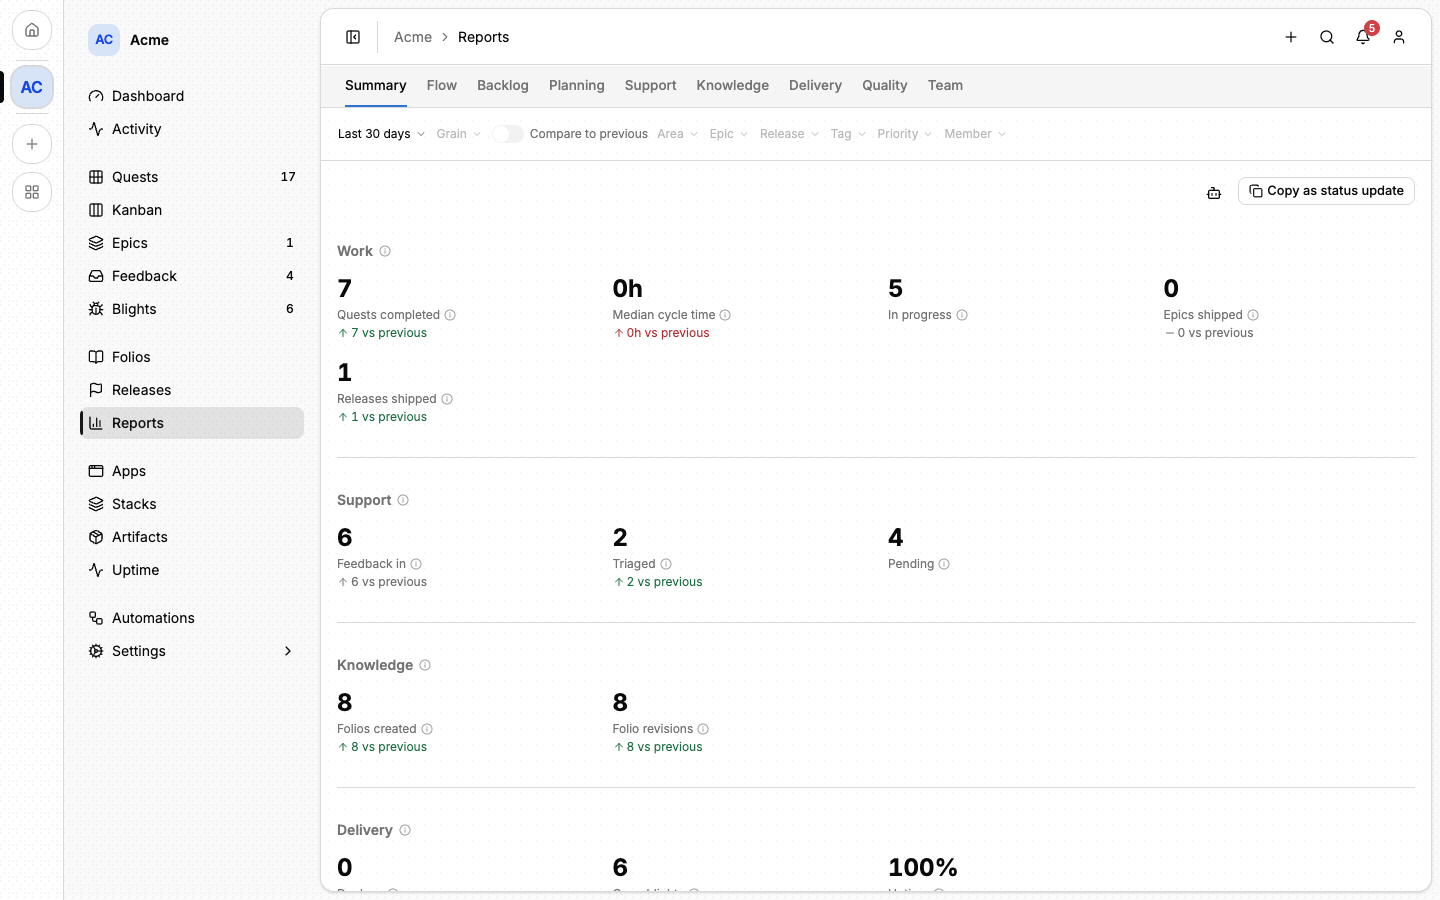
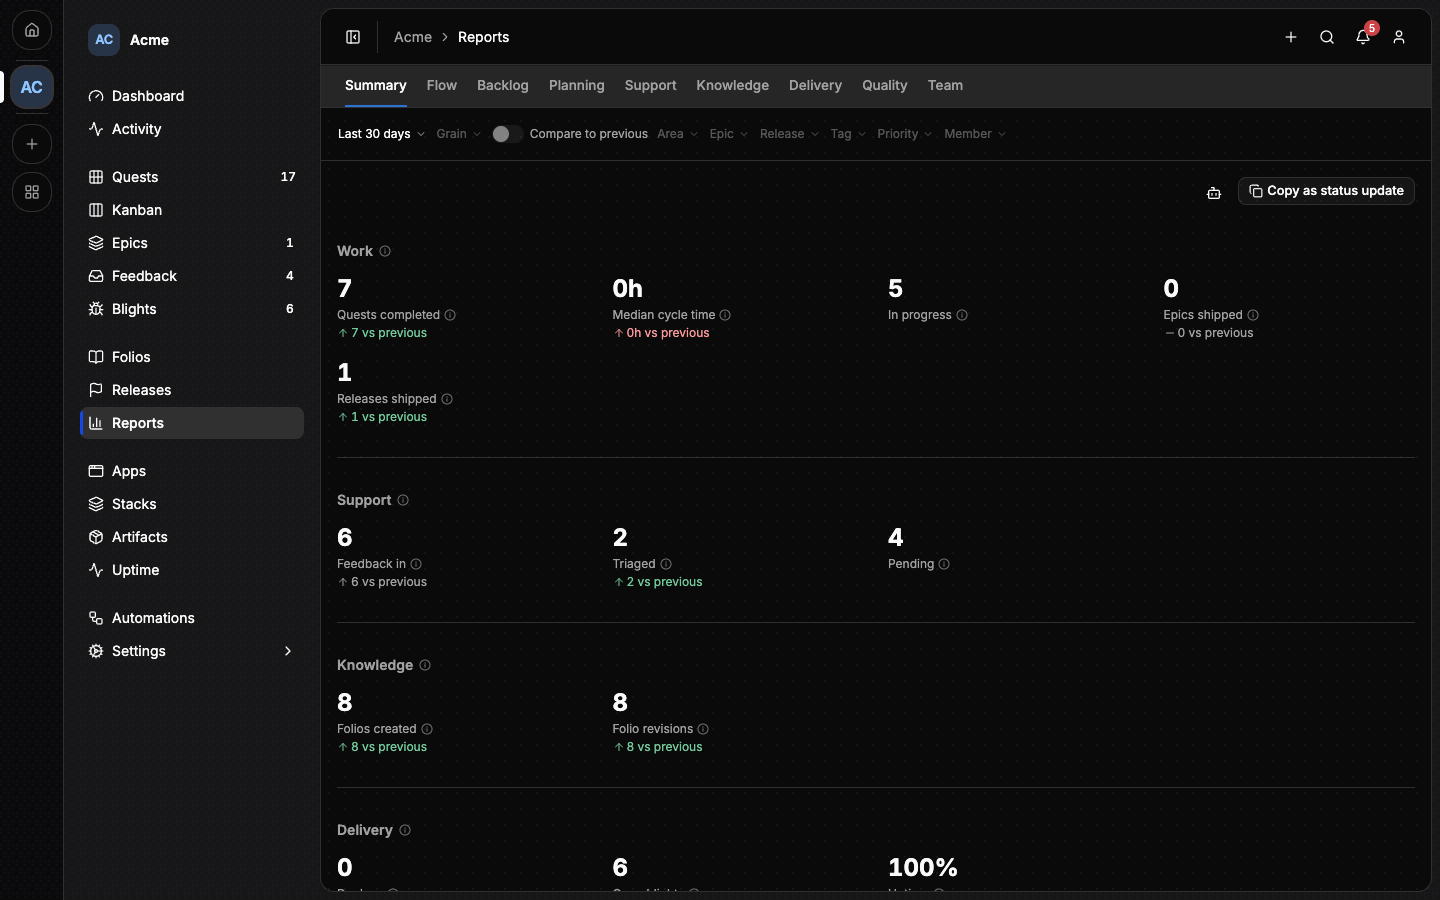
#The tabs
Each tab appears with the capability behind it, so a project with everything off still has Summary and Team. See Capabilities.
| Tab | Needs | Answers |
|---|---|---|
| Summary | - | Every capability's period against the one before, with a link to explain it |
| Flow | Work | How work moved: throughput, cycle and lead time, WIP, what is aging |
| Backlog | Work | The open work as it stands: by area, tag, priority, size, age, blockers |
| Planning | Work | Epics and releases: timeline, burn-up, scope change, forecast, slip |
| Support | Support | Feedback from intake to shipped |
| Knowledge | Knowledge | Folio activity, stale pages, orphans, the link graph |
| Delivery | Apps | The four DORA keys and reliability: blights, errors, uptime |
| Quality | Apps | Coverage and tests CI pushed, by branch, against a target, per release tag |
| Team | - | Load and contribution per member, how work arrives, agents, automations |
Start with Summary. Each of its lines links to the tab that explains it, and Copy as status update copies the whole summary as Markdown, ready to paste into a message.
#Choosing the period and the filters
The filter bar sits above every tab. It lives in the page's address, so a report can be linked, and moving between tabs keeps your filters. The default is the last 30 days.
- Period: 7, 30 or 90 days, 6 months, a year, all time, or a custom range.
- Grain: daily, weekly or monthly, picked from the period's length unless you choose. Weekly starts on Monday.
- Compare to previous: the same span just before, shown as deltas.
- Area, Epic, Release, Tag, Priority, Member: narrow the quests.
A tab shows the filters it does not honour as disabled, rather than quietly ignoring them. Team honours the period alone, because its activity data carries no area or epic.
A tag or a segment of a chart links to the quest list narrowed the same way. That list has no period, epic, priority or member filter, so it can show more than the chart counted.
Sections with a table or a chart offer CSV.
#What the figures count
Every report reads the same quests: shelved quests are out, and so are the open quests of a draft epic. A completed quest always counts, wherever it was filed.
| Figure | Counts | Divides by or notes |
|---|---|---|
| Throughput | Quests completed in the period | |
| Cycle time | Median time from accepted to completed | Hold time is taken out |
| Lead time | Median time from created to completed | Hold time stays: the requester waited |
| WIP | Quests accepted and not completed, now | Held quests are left out |
| Net growth | Created minus completed | |
| Waived | Objectives waived | Objectives decided, on completed quests |
| Progress | Quests done | Total, with shelved quests left out |
| Scope change | Quests added or cut after the epic started | What it started with |
| Triage time | Median time from received to accepted or rejected | Reports received in the period |
| Conversion | Accepted reports whose quests are all completed | Accepted reports |
| Deploy frequency | Successful deploys per week | |
| Lead time (deploy) | Median time from a quest completed to its first deploy | Matched by release tag or commit |
| Change failure | Failed deploys and rollbacks | Finished deploys. A rollback is inferred: a deploy back to a tag the instance already ran |
| Time to restore | Median time from an incident starting to it ending | From monitors |
| Uptime | Monitor time outside an incident | The period |
A median and a p85 go together: half the work took less than the first, and 85% less than the second, so one slow quest moves neither much.
A quest counts under each of its tags, so tag rows overlap and do not add up to the project.
Past states are rebuilt. The cumulative flow is exact from the day Lore began taking nightly snapshots of the project. For earlier days it is reconstructed from timestamps and quest history.
The forecast is a simulation: a Monte Carlo over the last twelve weeks of the project's throughput, not of the release. Half the simulated futures finish by the date shown.
Some counts have a starting day. Deploys and MCP calls are counted per project from the day Lore began recording them, so an older period can read zero there.
#The Team tab
Team shows what each member carries now (in progress, held, overdue) and what they did in the period: quests created and completed, comments, folio edits, feedback triaged, deploys. The table sorts By name or By load.
It never ranks people by output. The columns differ because the work does: a triager or a folio writer completes no quest and is not idle.
#Telling agents apart
An agent writes as the owner of its API key, so the author's name cannot tell the two apart. What can is the channel a write arrived on, which Lore records with every write:
| Channel | Is |
|---|---|
| Web | The browser |
| MCP (agents) | An agent over MCP |
| CLI | The lore CLI, recognised by its user agent, so a best guess |
| API | Anything else with a token |
| Automations | An automation rule |
| System | Lore itself |
| Not recorded | Written before channels were recorded |
How work arrives shows the writes per channel, and the Agents column of the member table is the share of that member's writes that came over MCP.
#The rest of the tab
- When work happens: writes per weekday and hour in UTC, over the last 30 days of the period at most, because older activity is kept per day.
- Automations: runs by outcome, success rate, duration, and broken rules. Run detail is kept 30 days.
- MCP tools: calls per tool that reached this project. A call refused before a permission check names no project, so a stranger's probing shows nowhere.
- Explore: a query builder over the project's activity and MCP calls, for the questions nobody anticipated.
#A weekly report in your inbox
The Weekly report preset in Automations sends Summary's last seven days against the seven before, every Monday at 08:00 UTC, to the member you pick, as an inbox notification or an email.
- It starts disabled, like every preset.
- A preset has one recipient, so reaching several members takes one rule each.
- A recipient opts out by turning off Automations in their notification settings: see Turning messages off.
#From the command line
lore project report prints one section as JSON, with the figures as the tab
reads them:
lore project report summary --project acme --days 7Sections are summary (the default), flow, backlog, planning, support,
knowledge, delivery, quality and team. Without --days, the period is
the last 30 days. See The lore CLI.
#From an agent
The project_report tool answers the same sections for the last N days. It
needs the same stats:read permission as the page. The Write the weekly
status prompt on the Summary tab builds on it: see
Agent prompts, and
MCP tools for the full list.
#Next
- Dashboard: pin the figures you check every day.
- Automations: set up the weekly report.
- Quests: the work every figure counts.
- Telemetry: the blights and errors the Delivery tab counts.